
As part of an impressive campaign to discredit the Athens Spring, and those of us who continue to honour and propagate its spirit, a cabal of journalists and ‘analysts’ have joined forces to depict me as the “destroyer of the Greek economy.” The purpose? To demonise the Greek people’s audacity to elect us with a mandate to oppose the Troika in the Spring and early summer of 2015, when they backed our stance with that magnificent 62% NO vote.
Their hideous campaign was summed up recently in the so called ‘Varoufakis Effect’ argument, by Berenberg’s Chief Economist, a Mr Schmieding. Using a chart that ‘shows’ business confidence to have collapsed during the days of my tenure in the ministry of finance (first half of 2015), he pinned on me Greece’s woes. Naturally, the troika’s Greek cheerleaders, with newspaper TO VIMA at the forefront, grabbed the opportunity to jeer and snarl. Except that they were caught with the smoking gun in their hands…
In response to Mr Schmieding’s piece, I wrote this article in Project Syndicate. Its gist? That the Greek economy was damaged purposely by a Troika intent on punishing Greek voters for having elected us to challenge the Troika’s failed policies. Mr Schmieding simply laundered the Troika Effect as a ‘Varoufakis Effect’, using the following chart.
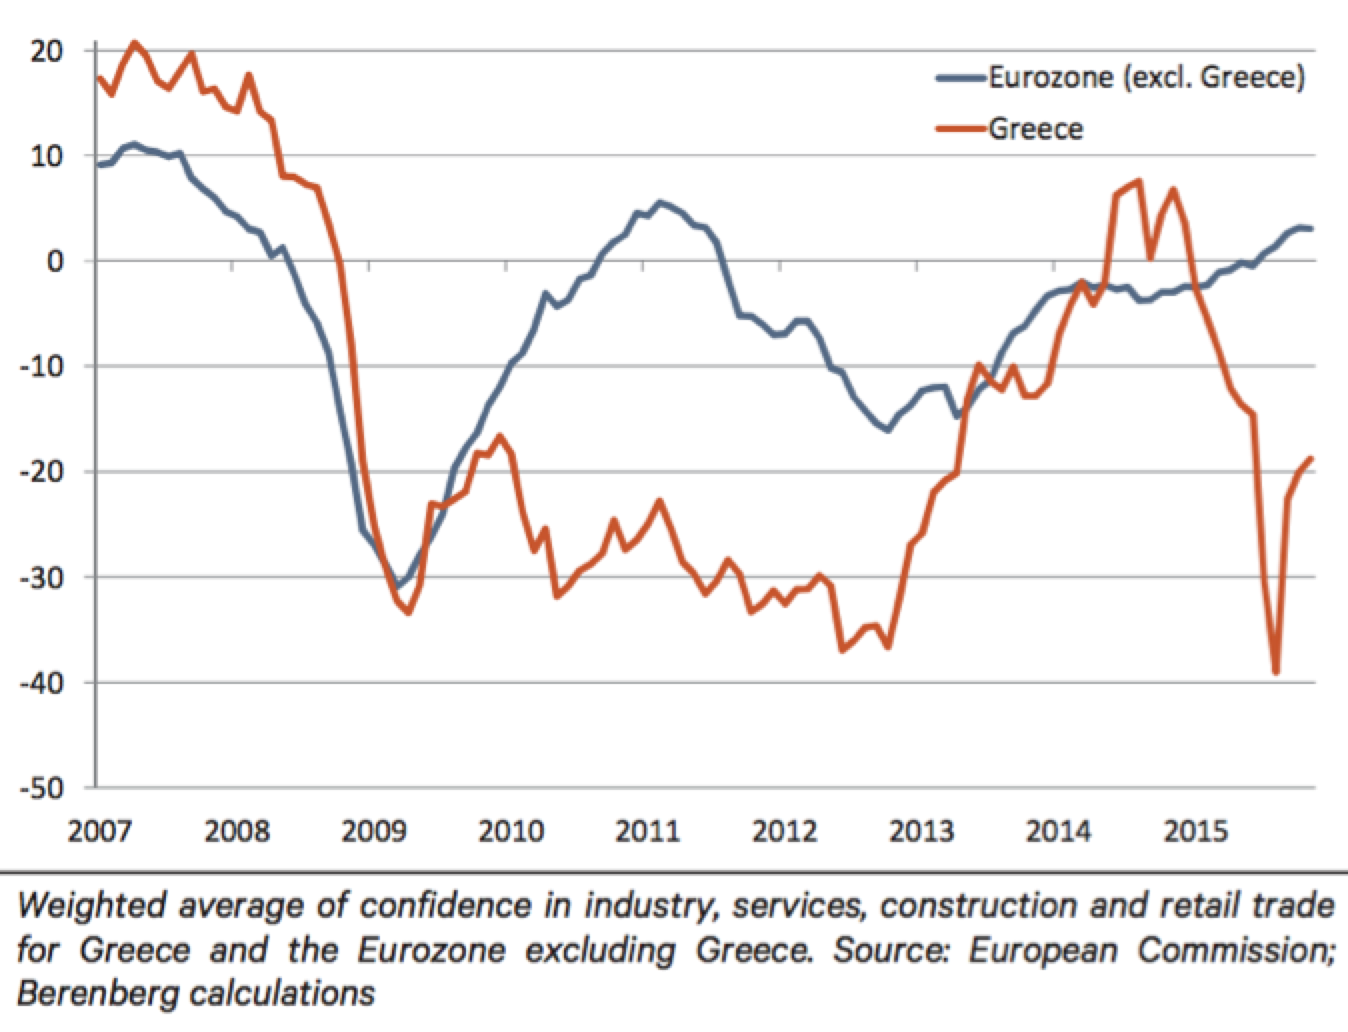 However, the story does not end here. Following the publication of my Project Syndicate article, various readers were kind enough to point out that the chart Mr Schmieding used to found his ‘Varoufakis Effect’ hypothesis was, in fact, doctored. The original chart (published here) – and reproduced below for convenience – shows clearly that business confidence took a major dive at the end of 2014, well before the general election and my appointment as minister of finance. And that it rebounded not when I left office (in July 2015) but before my appointment in early January 2015 (see diagram below).
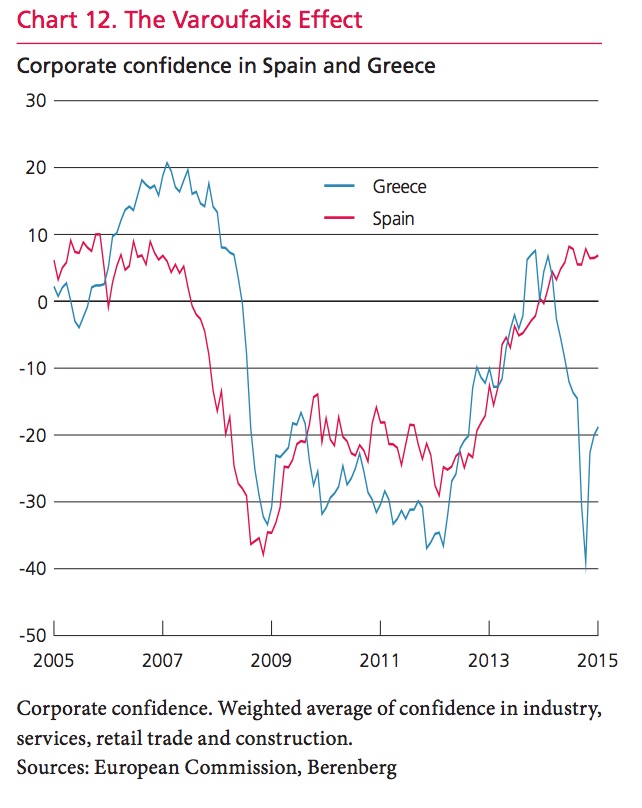 Miraculously, in the chart that Mr Schmieding included in his letter to his investors, the horizontal axis was ‘stretched’ (compare the two graphs above) to show that business lost its mojo well into 2015, during my period in office.
The point I made in my Project Syndicate article that investors have much to fear from analysts like Mr Schmieding, could not have been better illustrated…


